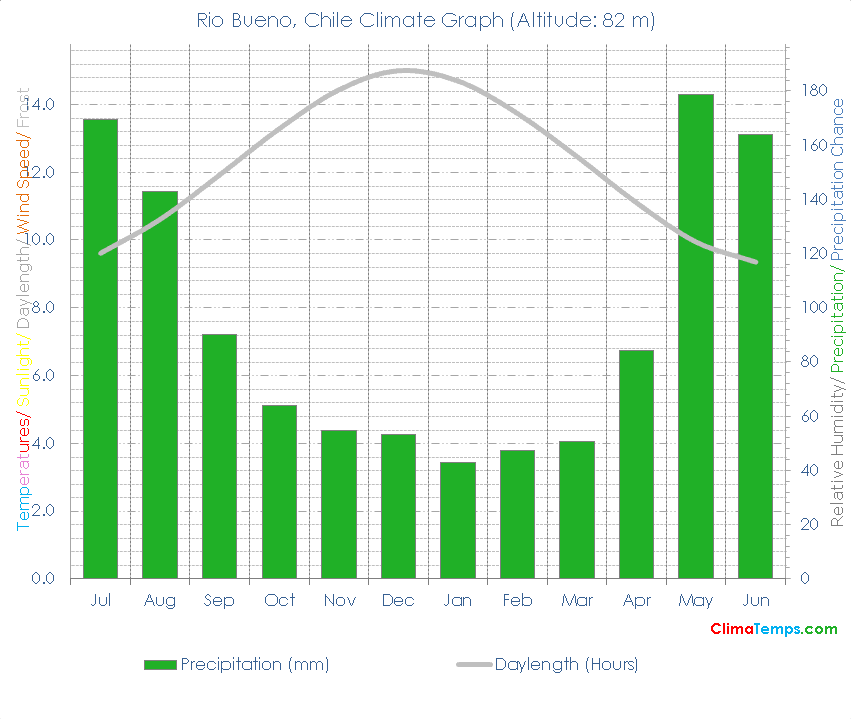
The first graph shows the climate in Rio Bueno, Chile in metric units and the second in English units. The climate graphs depict monthly average temperatures, precipitation, wet days, sunlight hours, relative humidity and wind speed.
Rio Bueno, Chile Climate Graph in Metric Units
Rio Bueno, Chile Climograph in English Units
Your Share Will Make An Essential Difference!
Please take a moment to share a climate graph or simply the address:
Thank You, so much! ❤️